Chapter 3 Confidence Intervals
What is the standard error and how is it used?
In unit 2 we showed that the standard error is a type of standard deviation. This describes how variable the data is and how far the data is from the mean.
The important difference is that the standard error is used when there is an inferential statistical analysis using a sample and the true population statistics are not known.
Confidence interval tell us how confident we can be that the there is a difference between the null hypothesis.
3.1 How The Size Of The Standard Error Represents Confidence
Recall that the standard error describes the variability of the data. The more variable the data the less confidence there is. For example, assume that every week you get paid very different amounts. Some weeks you get paid a large amount, some weeks a reasonable and moderate amount, but other weeks you get paid very little. This type of pay is very variable. Would you have much confidence in the amount of money you have to spend every week? Most likely you would have little confidence. This is because the variability is so large. The standard error is similar. Large standard error lead to less confidence. However, smaller standard errors allow for high confidence. Next we will introduce how to calculate standard errors followed by the details of confidence intervals.
3.1.1 Factors That Influence The Size Of The Standard Error
The main factor that affects the size of the standard error is the sample size. Because the denominator of the standard error is the square root of the sample size (Eq.3.1) as the sample size gets larger the standard error becomes smaller.
3.1.2 The Standard Error Of The Mean Equation
Eq. 3.1

3.1.3 Factors That Influence The Size Of The Standard Error In Regression
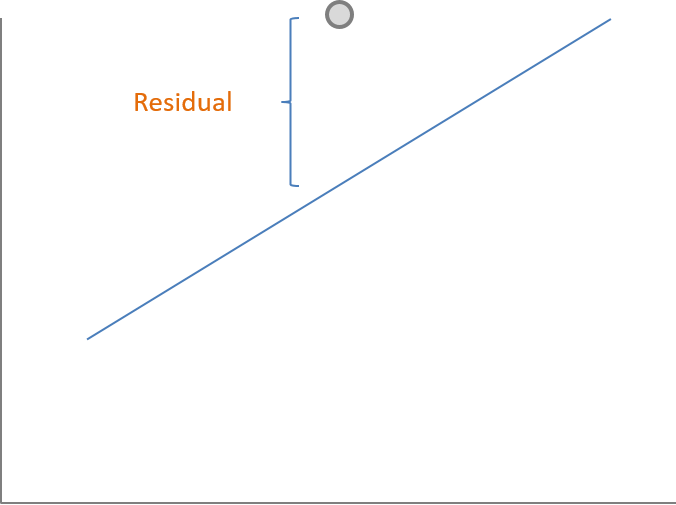
We will discuss more details about the regression model in the next few units. Recall that because every data point does not usually fall in a perfect line there is usually space between each data point and the regression line. The distance between the data point and the regression line is called the error term or residual (Fig.3.1). One way to decrease the size of the standard error is to add more variables.
3.1.4 The Residual In Regression
Fig. 3.1
3.1.5 Factors That Influence The Size Of The Standard Error In Regression
Recall that the regression slope, \(B\), describes the impact on the dependent variable or output. It describes how many units the output will increase or decrease for every one unit of change of the independent variable or input. There is also a standard error of \(B\). The calculation is similar. Eq. 3.1-3.4 show the formulas to calculate the variance and standard deviation of the slope. In Eq. 3.3 \(SSE\) is the sum of squared error term. It is analogous to the sum of the deviation of the sum of the deviations from the each data point and the regression line. Eq. 3.5 Shows the formula for the standard error of the regression slope. Just as with the standard error of the mean you must first calculate the variance.
3.1.6 The Variance And Standard Deviation Of The Regression Slope Equation
Eq. 3.2 \(SSE = ({\hat{y}_i} - \bar{y})^2\)
Eq. 3.3

Eq. 3.4

3.1.7 The Standard Error Of The Regression Slope Equation
Eq. 3.5

Two other ways to decrease the size of the standard error are (1) increase the sample size and (2) to increase the variance of \(x\). Increasing the sample size will decrease the variance of the regression slope by increasing the denominator of the variance (Eq.3.5). Similarly, increasing the variance of \(x\) will increase the denominator of the standard error of the slope leading to a smaller \(SE_b\).
3.2 Standard Errors And Confidence Intervals
Recall that Confidence intervals tell us if we repeat an experiment many times we would expect a certain percentage of the experiments to contain the true mean in the confidence interval. Often people use 95% confidence intervals.
If the experiment is repeated 100 times we would expect 95 of those experiments to contain the true mean within the confidence interval.
In order to calculate confidence intervals we must know how variable the data are. This is estimated by the standard error. We can now use the standard error to calculate the confidence interval
3.2.1 Calculating The Confidence Interval Of The Mean
Recall that the standard error is a type of standard deviation. However, it is used when we are calculating statistics from a sample and do not know the true population statistics. The formulas and equations are very related and similar. You likely have seen in earlier statistics courses how to calculate the t-statistic.
The t-statistic is used to determine the probability that you would get the results that you obtain from your sample if the results were due to random chance. In other words, it is very similar to confidence intervals. If you are interested in a probability or p-value of less than 5% or .05 to be significant then a t-statistic that shows the p-value is less than .05 you believe that the results were not due to random chance, rather they were due because there is a true difference between the mean of your sample and the population mean. For example, a t-statistic that shows a p-value of less than .05 in a study where you wanted to know if a drug worked better than a placebo you would infer that the results of the drug were not due to random chance.
The t-statistic is integrally involved in the calculation of confidence intervals. One reason is that, as with t-tests, we have a probability value or in this case a confidence level. In calculating the t-statistic for the confidence interval we must know the degrees of freedom. A t-statistic for the mean has \(n-1\) degrees of freedom or the sample size minus 1. The t-statistic for the regression slope, \(B\), the degrees of freedom are \(n-k-1\) or the sample size minus the number of regression paramaters, \(B\)’s, minus 1.