Working with tables in R (data.table vs dplyr)
Preparing data for the analysis takes plenty of time and commonly is considered as one of the less favorite parts of any data science job. It is commonly stated that “data preparation accounts for about 80% of the work of data scientists”.
Several R packages are widely known in the R community for their great list of functions, making the data wrangling process easier. Among them:
-
dplyr - a grammar of data manipulation, providing a consistent set of verbs that help you solve the most common data manipulation challenges.
-
data.table, which allows the quick aggregation of large data (e.g. 100GB in RAM), fast ordered joins, fast add/modify/delete of columns by group using no copies at all, list columns, friendly and fast character-separated-value read/write.
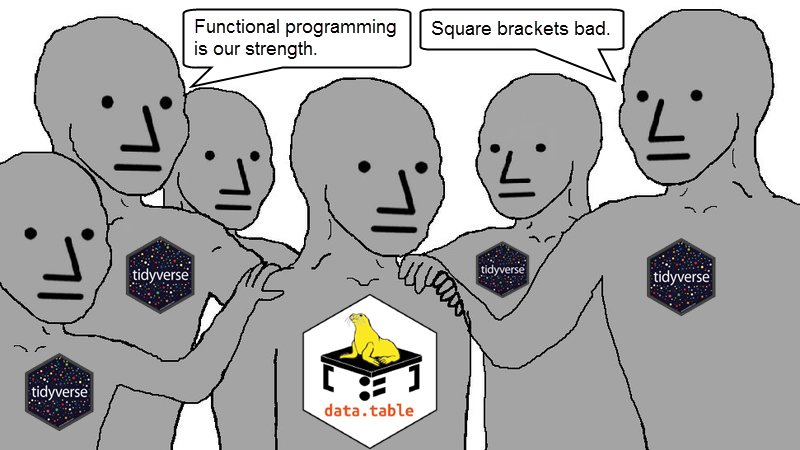
Both packages have own loyal fans for different reasons (e.g. speed of processing vs simple syntax), boost Twitter clashes, and even became an inspiration for memes.

A data.table and dplyr tour, written by Atrebas, offers a comparison of the syntax in both packages, allowing users to make their own conclusions about its benefits. Newcomers of the R communitiy traditionally value the simplicity of the dplyr syntax, while fans of data.table instist on more powerful functionality of their favorite package.
# select rows in data.table
DT[ V2 > 5 ]
DT[ V4 %in% c("A","C") ]

# select rows in dplyr
DF %>% filter( V2 > 5 )
DF %>% filter( V4 %in% c("A","C") )
Please read the blog post, mentioned above, and make own conclusions and choices.
