Getting Started
New to Data Science?
Welcome to the “sexiest career of the 21st century”. This page contains some resources to help you get oriented to some of the foundations of the field.
CONTENT:
- New to Data Science?
- Getting Started
- The Open Source Ecosystem
- Data Programming Languages
- Data-Driven Documents
- Collaboration Tools
- The Data Science Toolkit
Getting Started
There are a few platforms and skills that serve as the foundations of data analytics. If you are new to the field, start by familiarizing yourself with these concepts.
-
The Open Source Ecosystem
-
Data Programming Languages
-
Data-Driven Documents (Markdown)
-
Collaboration Tools
More advanced work in data science will dive deeper into statistical models and machine learning approaches.
The Open Source Ecosystem
Open source tools and data programming languages have evolved rapidly and are quickly becoming industry standard for data scientists.
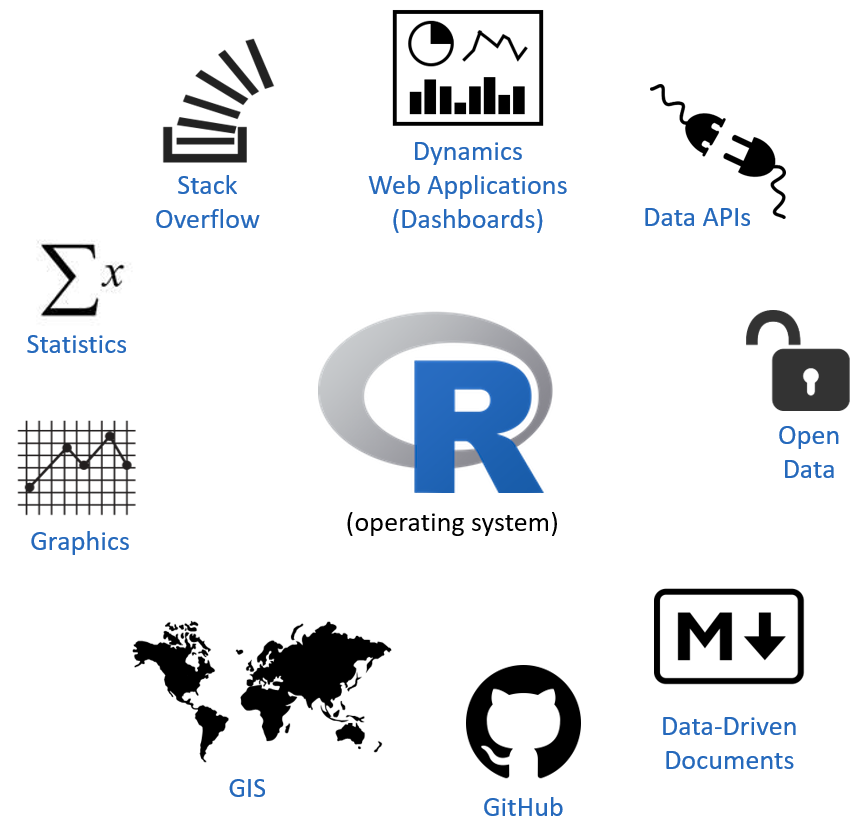
The R community has taken this to another scale. There are currently 13,000 free and open-source packages available in R. It is better to think about R as an operating system, and the contributed packages as the programs you use for specific tasks.
In addition to packages created for R, there are also powerful tools that make it easier to share data, collaborate on work, and share your results in creative ways. One of the reasons R has become an industry favorite is that it is highly integrated into this ecosystem. Many of these tools are built-right into R Studio, making it easier to manage large projects or collaborate.
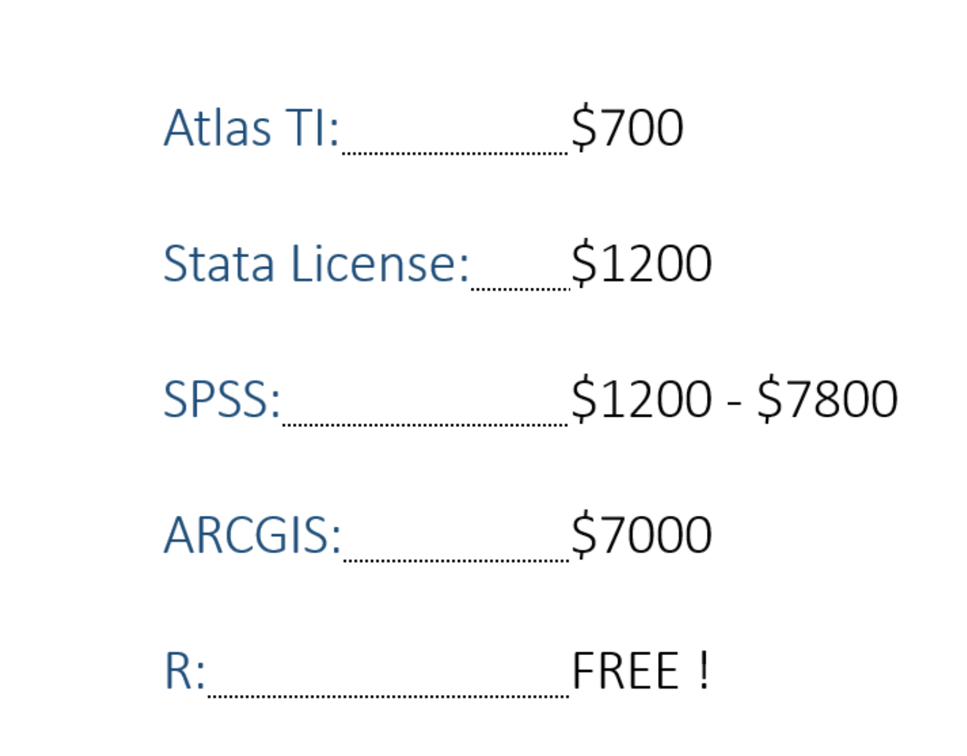
Public Affairs programs are adopting these technologies because they are free and powerful. A single data programming language like R can perform statistical analysis, dynamic reporting, GIS, analysis for qualitative research, and other functions, meaning it can be substituted for several expensive software licenses, making it a good choice for public sector and nonprofit organizations that don’t have large technology budgets.
It also lends itself to open innovation since analytical solutions to public sector problems can be easily shared and adopted across localities to encourage collaboration and support an ecosystem of performance.
There is a non-trivial learning curve to master some of the tools, but the good news is that there are now plenty of good resources.
Data Programming Languages
Working in the field of data science requires a data programming language. R and Python are the two most common functional programming languages you will encounter. Typically if come from the field of computer science you are likely a Python programmer, and if you come from the social sciences or statistics you typically use R. There are pros and cons to each, but both are powerful and flexible.
Hadley Wickham made the following helpful observation regarding differences between R and Python:
A pattern that I see is that the data science team in a company uses R and the data engineering team uses Python. The Python people tend to have a background in software engineering and are very confident about their programming skills. They see R and it looks very weird, and say with a lot of certainty these facts about R [not being as good].
The R users are generally not as confident in their programming skills. They really like R, but can’t argue with the engineering team, because they don’t have the language to make that argument. People using R tend to have these backgrounds in biology or marketing and they don’t have the vocabulary. R is a weird language but it is weird for good reasons, and it’s a really good fit for data science. It’s not a general purpose programming language, but there are good reasons for a lot of the things it does.
You will find that specific communities of practice will converge on one or another. McKinsey, for example, has a preference for R. The Urban Institute feels that R is good for innovation and made a strategic choice to build an R user community. They have been investing in the creation of tools and infrastructure that make it easier for data scientists and analysts to use R as part of a data engineering and analysis pipeline.
This site will emphasize R-based approaches for expertise reasons only, but Python-based applications are common in the public sector as well.
Resources for Learning R [ link ]
Online Courses
Coursera: R Programming
Datacamp: Free Introduction to R
Code School: Try R
Graphics in R: FlowingData
Learn R in R: Swirl and Swirl Course List
Useful Cheat Sheets and References
R Style Guides [ Google’s] [ Hadley Wickam’s ] [ datacamp ]
R Cheat Sheet Library [ link ]
Short Reference Card [ link ] [ link ]
Project Management Guide [ download ] [ link ]
GitHub is Going Mainstream [ link ]
Data Science Toolkit [ link ] [ rpackage ]
Recommended Textbooks
Kabacoff (2015), R in Action [ github ]
Teetor (2011), R Cookbook [ pdf ]
Chang (2013), The R Graphics Cookbook [ github ]
Matloff (2012), The Art of R Programming [ github ]
Spector (2008), Data Manipulation with R [ github ]
Stanton (2013), Introduction to Data Science [ free download ]
Wickham (2015), Advanced R [ free online ]
Schwarzer et. al (2015), Meta-Analysis with R
Chen & Peace (2013), Applied Meta-Analysis with R
Data-Driven Documents
For the purpose of transparency and reproducibility, as well as simple convenience, there is high demand for documents that combine typical elements of publications and reports such as text, tables, graphs and images, and the code that was used to create the analysis presented in the text. These efforts have largely converged on Markdown as a simple publishing language, and derivations like R Markdown to incorporate output from models into documents.
Markdown
Markdown is a simple set of rules used to format text and images. Formatting it accomplished by adding tags to text.
# H1
## H2
### H3
The basics are very easy to master by referencing a basic Cheat Sheet or Tutorial.
But don’t let the simplicity fool you. Markdown documents are extremely versatile and powerful. Using the same text and code in a document, minor changes can be made to select a variety of document outputs that best meet the needs of the client or team. For example, check out the diversity of formats available in the R Markdown Gallery.
R Studio makes it easy to create R Markdown documents, and you can select the format by changing the output type. Perhaps you have a regular report created as an HTML page:
---
output: html_document
---
And you want to re-organize the material into a dashboard. Simply change the output type:
---
output: flexdashboard
---
Then add a few page dividers, and your analysis will now be organized something like this StoryBoard.
Markdown is used on GitHub, Stack Overflow, and in R Markdown documents. Familiarity with the basics offers a lot of power in controlling how your analysis is presented to your audience.
Templates
Checkout many types of R Markdown formats HERE.
Check out some NICE THEMES for R Markdown documents.
Download a simple R Markdown Template HERE.
Embed Shiny Widgets in your documents to make them interactive TEMPLATE.
Checkout some simple Flexdashboard LAYOUTS.
If you would like to build interactive tutorials in markdown checkout learnr.
You can see some advanced R Markdown features HERE.
Collaboration Tools
GitHub
Working in groups is hard. Most work is done in groups. As a result, project management is a non-trivial task that should not be approached in an ad-hoc fashion. The field of data science has inherited many great collaboration tools that were developed to manage large teams of software engineers, but are being used for many other creative purposes:
The Data Science Toolkit
The main difference between commercial software and open source tools is flexibility. Commercial software needs to have an intuitive user interface and high performance. As a result, commercial applications typically focus functionality on a few tasks.
Open source programs, on the other hand, are less elegant but more flexible. When you are new to the ecosystem this trade-off will be frustrating. Why aren’t packages easier to use? Who wrote these help files and where did they learn human languages?
Over time, though, you will grow to appreciate that the power of these tools more than compensates for their usability. Pete Warden created a great site he titled The Data Science Toolkit to demonstrate a few cool applications that make it easier to acquire, enrich, and utilize data:
http://www.datasciencetoolkit.org/
It is useful to think about R more as a toolkit (collection of powerful packages) than as a programming language. Once you understand the syntax, you have access to all of these powerful tools that will allow you to create create better projects, and build them faster.
R Packages
There are approximately 15,000 R packages available on the CRAN. In order to make it easier to find the tools you need they have been organized into Tast Views or you can find curated lists of nice packages.
Some of the most useful packages have been created by Hadley Wickam and the R Studio group. If you are new to R, their list of recommended packages is not a bad place to start.
If you would like to see which pacakges are currently popular, you can view package downloads from the CRAN in real time here:
https://gallery.shinyapps.io/087-crandash/