Discussion Topics
New Topic| Issue | Labels | Created on |
|---|
Data Science Communities
R Communities
R Open Science [ link ]
R Open Government [ link ]
R Ladies [ link ] nice write-up
Local User Groups [ list ]
R Studio Discussions [ link ]
Conferences [ link ]
Professional DS Networks on Government and Nonprofits
Nonprofit Open Data Collective [ link ]
GitHub’s Government Team [ link ]
Ford Foundation: Public Interest Technology [ link ]
Bloomberg Foundation: What Works Cities [ link ]
ARNOVAs Data and Analytics Section [ link ]
Data Science for Social Good (Georgia Tech) [ link ]
Data Science for Social Good (U Chicago) [ link ]
DataKind [ link ]
Technology Association of Grantmakers (TAG) [ link ]
The Association of Public Data Users (APDU) [ link ]
GovLab [ link ]
GovEx [ link ]
Education Policy
OpenSDP [ tools ], part of the Strategic Data Project at Harvard
Data Journalists, Bloggers & Civic Groups
Open Journalism on GitHub (over a dozen newspapers) [ link ]
Trend CT [ link ] [ github ] [ style guide ]
Todd Schneider [ blog ] [ github ]
I Quant NY [ blog ]
ChartsNThings: A Blog by the NYT Graphics Dept [ link ]
Data for Democracy [ link ]
BBC Data Viz Library [ link ]
Public Health
R Epidemics Consortium (RECON) [ link ]
[R for Epidemiology [ link ]
The Epidemiologist R Handbook
Disaster Management
Advanced Urban Disaster Resilience Analytics Lab [ link ]
Natural Hazards Center [ link ]
NHERI Network [ link ]
CONVERGE Center [ link ]
Blogs and Listservs
R-Bloggers [ link ]
R Weekly [ link ]
Stack Overflow [ link ]
Flowing Data [ link ]
Podcasts
Data Points by GovEx [ link ]
Partial Derivative [ link ]
DMV Nation [ link ]
Becoming a Data Scientist [ link ]
Data Stories [ link ]
Talking Machines [ link ]
Not So Standard Deviations [ link ]
Data Skeptic [ link ]
More Or Less [ link ]
Linear Digression [ link ]
R-Podcast [ link ]
Artificial Intelligence the Podcast [ link ]
Conversation Themes
We invite conversation around data sources, methods, and substantive research themes. For questions about code, please see the rules listed below.
You will need a free GitHub account to post a question on the discussion board.
Once you have posted a question or a comment you are subscribed to the conversation automatically. You can subscribe to a topic by selecting the “Notification” feature, or similarly unsubscribe.
Rules for Questions About Code
There is some skill involved in asking coding questions so that they are clear, and providing a simple example that demonstrate your particular problem. This will improve the responses that you receive. For a more in-depth overview, see the blog devoted to asking clear questions on StackOverflow.
Don’t Repeat Questions
Check the existing list of questions and topics to make sure your questions has not been asked already. Often times the answer already exists, you just need to read a couple of previous discussions.
State Your Goal
Often times people will post code without explaining what they are trying to do. Be clear about your goal so that the problem is easier to spot.
Include Your Code
There are a million ways to do something incorrectly, so we cannot guess what you are doing wrong unless you show us. Don’t write questions like:
I am trying to merge my data, but I keep getting the error message, “x is not a factor”.
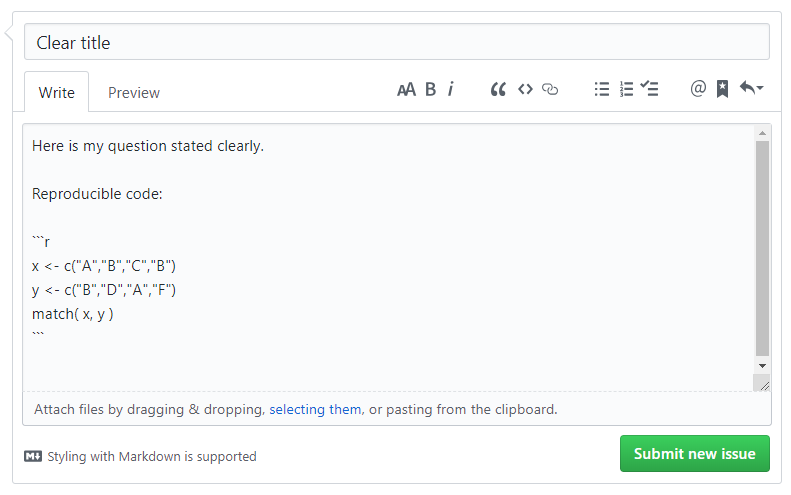
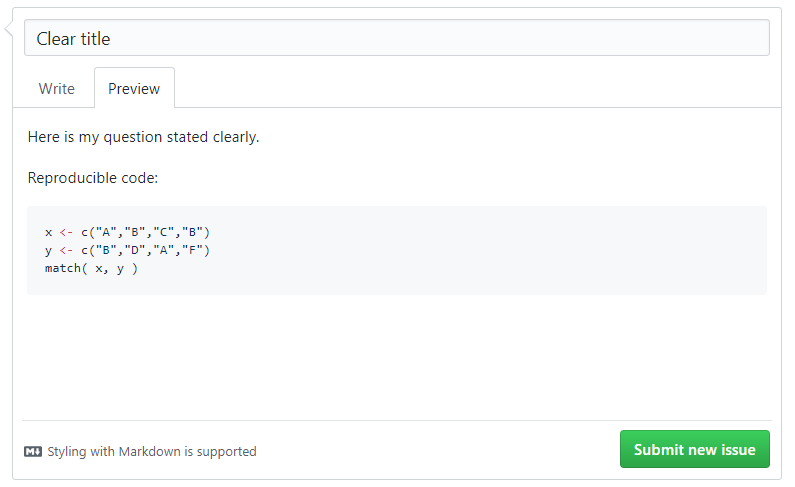
You need to show the code that generated the error message. GitHub speaks Markdown, which allows you to write questions that include reproducible code so that others can easily diagnose the problem and offer you solutions.
So instead of the cryptic phrase above, try something like:
I am trying to merge my data, but I keep getting the error message, “cannot merge object type list”. Here is my code:
x <- data.frame( id=letters[1:10], v1=rnorm(10) )
y <- data.frame( id=letters[1:10], v2=rbinom(10) )
z <- list( x, y )
merge( y, z )
Write Clear Code
Computer code for the most part ignores spaces, you don’t have punctuation, and you can nest functions, style describes how readable and clear your code is. You can write accurate and functional code that is really hard to interpret. With good style it will be easier to share and maintain.
This example was inspired by the German language, which includes this whopper:
Donaudampfschifffahrtselektrizitätenhauptbetriebswerkbauunterbeamtengesellschaft
It means, “Association for Subordinate Officials of the Head Office Management of the Danube Steamboat Electrical Services”. Although technically allowable, these compound German words are impossible to read and pronounce.
Similarly, your code technically might be correct, but it is much easier to read if you treat each argument as a separate word and use spaces accordingly. Which is easier to understand?
y<-cut(rank(x),breaks=seq(from=1,to=100,by=10),labels=paste("X",1:10,sep=""))
Or:
y <- cut( rank( x ), breaks=seq( from=1, to=100, by=10 ), labels=paste( "X", 1:10, sep="" ) )
Here are two popular style guides for R:
Include Example Data
You can include data in your questions in a few ways.
There are some functions that allow you generate random data that can be used to demonstrate the problem.
Many packages include built-in datasets that can be easily loaded with the data() function.
data( USArrests )
> head( USArrests )
           Murder Assault UrbanPop Rape
Alabama      13.2     236       58 21.2
Alaska       10.0     263       48 44.5
Arizona       8.1     294       80 31.0
Arkansas      8.8     190       50 19.5
California    9.0     276       91 40.6
Colorado      7.9     204       78 38.7
If the data is important for your question, you can post a small sample of your data using the dput() function. For example, here is the dput() output from the US Arrests dataset that comes with R.
> dput( head( USArrests ) )

structure(list(Murder = c(13.2, 10, 8.1, 8.8, 9, 7.9), Assault = c(236L,
263L, 294L, 190L, 276L, 204L), UrbanPop = c(58L, 48L, 80L, 50L,
91L, 78L), Rape = c(21.2, 44.5, 31, 19.5, 40.6, 38.7)), .Names = c("Murder",
"Assault", "UrbanPop", "Rape"), row.names = c("Alabama", "Alaska",
"Arizona", "Arkansas", "California", "Colorado"), class = "data.frame")
And here is what the output looks like after being pasted back into R:
> structure(list(Murder = c(13.2, 10, 8.1, 8.8, 9, 7.9), Assault = c(236L,
+ 263L, 294L, 190L, 276L, 204L), UrbanPop = c(58L, 48L, 80L, 50L,
+ 91L, 78L), Rape = c(21.2, 44.5, 31, 19.5, 40.6, 38.7)), .Names = c("Murder",
+ "Assault", "UrbanPop", "Rape"), row.names = c("Alabama", "Alaska",
+ "Arizona", "Arkansas", "California", "Colorado"), class = "data.frame")

           Murder Assault UrbanPop Rape
Alabama      13.2     236       58 21.2
Alaska       10.0     263       48 44.5
Arizona       8.1     294       80 31.0
Arkansas      8.8     190       50 19.5
California    9.0     276       91 40.6
Colorado      7.9     204       78 38.7
Thus dput() makes it easy for people on the discussion board to re-create your original dataset.