R Reference Material
The R Language
R is a data programming language developed for statistics.
We will be using R for lectures and labs in this course. If you are only taking the program evaluation course, you only need a rudimentary understanding of R. The code you need to run regressions and create tables will be provided to you. All of the datasets we will use for lectures and labs are pre-packaged, so you don’t have to know how to build datasets in R.
You will see, however, that I provide a lot of code in lecture notes. This is primarily for the students also taking the Intro to Data Science class (CPP 526) or enrolled in the masters program in data analytics. The more code you see, the more familiar it will become. It also let’s you build off of existing code and incorporate it into your own projects. It is presented as a resource, not because you are expected to be able to make sense of it all of it or use it in labs, rather because the courses are designed to be immersive.
Instead of isolating lectures and labs in a university learning platform, this content is presented in the formats and environments you will might encounter in professional analyst role.
The R Toolkit
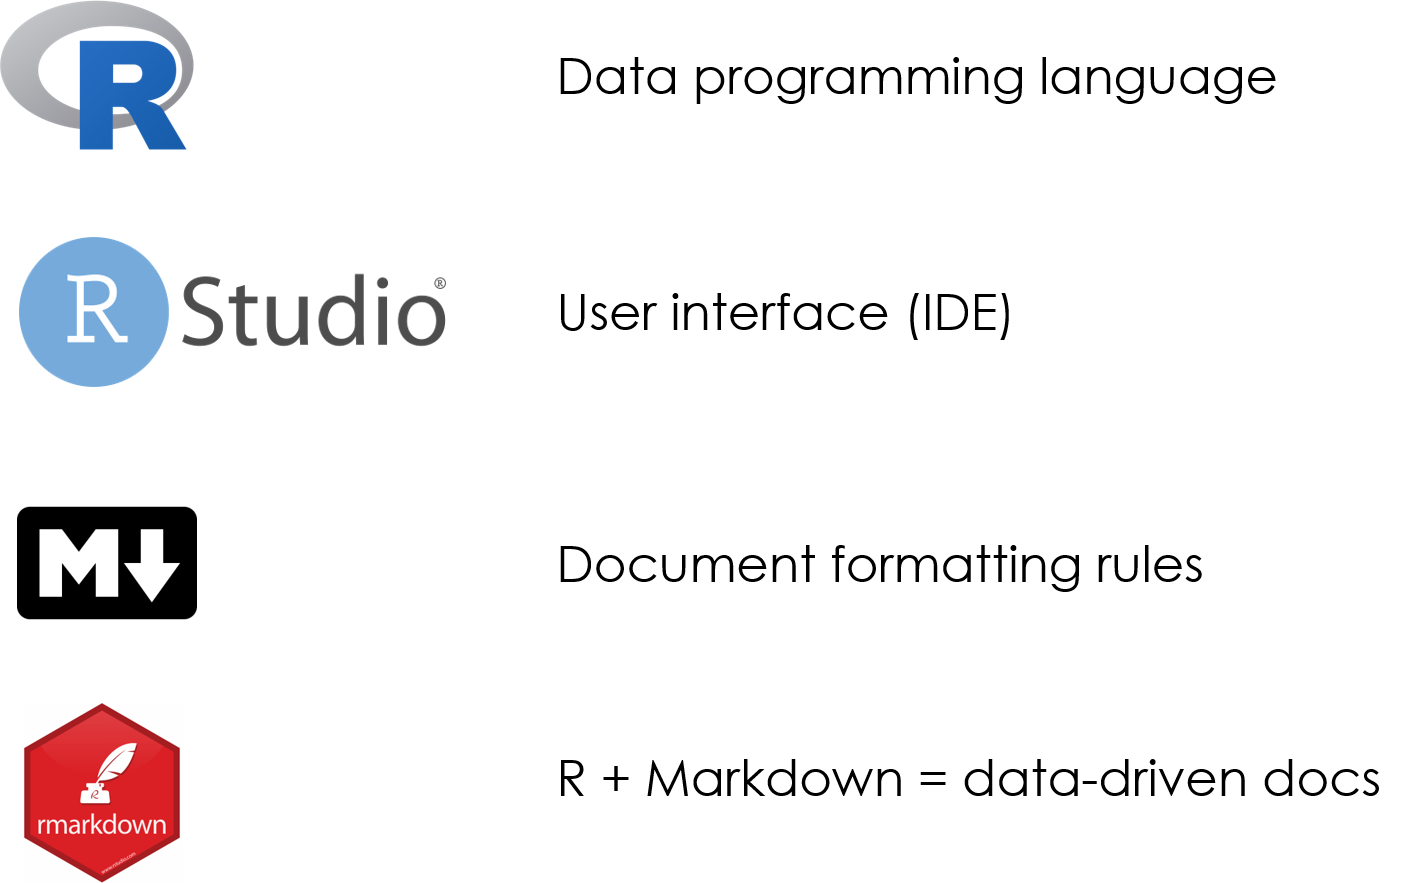
In this course we cover the foundations of data programming with the R language. In order to create robust and dynamic analysis we need to use a couple of tools that were built to leverage the power of R and create compelling narratives. R Studio helps you manage projects by organizing files, scripts, packages and output. Markdown is a simple formatting convention that allows you to create publication-quality documents. And R Markdown is a specific version of Markdown that allows you to combine text and code to create data-driven documents.

Installing R
You will need to install R (the open-source analytics platform used in this course) and R Studio (the graphical user interface for R).
R Markdown
Getting Started with R Markdown
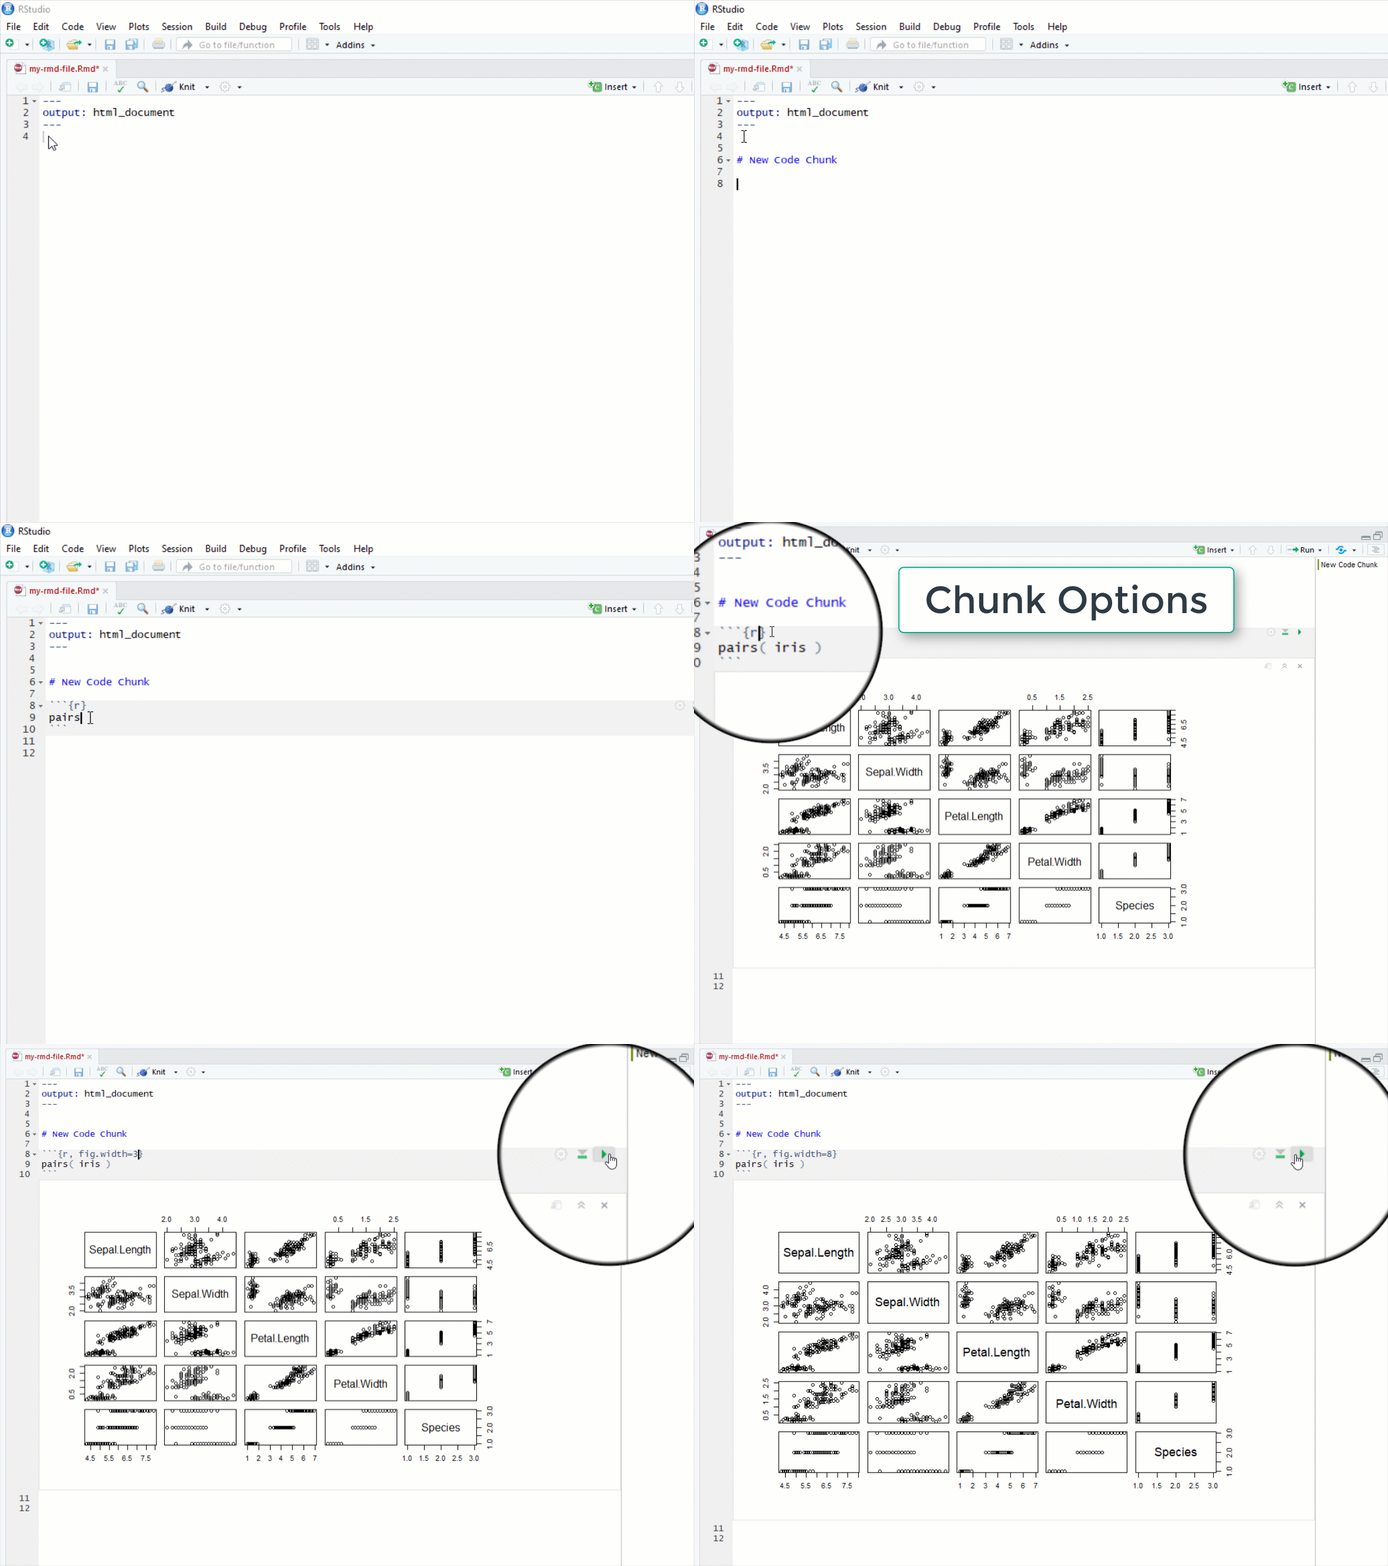
You will have plenty of practice with these tools this semester. You will submit your labs as knitted R Markdown (RMD) files.
RStudio
RStudio is a graphical user interface (GUI) and integrated developer environment (IDE) that makes it much easier to use R for writing code, importing and exporting data, installing extensions, and many other features.
R Studio Walk-Through
Use the bookmarks in the video description on YouTube to skip ahead to different parts of the tutorial.
Content:
- Opening a New Script: 00:31
- Saving Scripts: 01:35
- Sessions & Setting Working Directories: 04:13
- The Source/Script Pane: 06:15
- The Console Pane: 09:12
- The Environment, History, & Connections Panes: 12:04
- Importing Data: 12:26
- Objects & the Environment Pane: 14:26
- The Files, Plots, Packages, Help Panes: 16:16
- The Help Pane: 18:04
- Keyboard Shortcuts: 23:48
- The RStudio Cheatsheet: 29:07
- Customizing Your Interface: 30:20
The Data Science Ecosystem
R is a foundational tool within a toolkit that I will refer to as the “data science ecosystem”.
If you were not able to make either Zoom session, I did a brief introduction to the “ecosystem” - the community of people that are creating cool analytical tools and building tutorials and case studies for how they might be applied, as well as a core set of tools that are all designed to work nicely together in order to implement projects.
You can think of R, R Studio, and Markdown kindof like Excel (analysis), Word (report-writing), and Power Point (presentations). R allows you to analyze your data, but these results are not useful unless you can share them with others. Here is where data-driven documents developed using R Studio and Markdown really shine. You can quickly package your R code as cool reports, websites, presentations, or dashboards to format the information in whatever way is most accessible and useful for your clients or stakeholders.
