
Overview
In the first lab we looked at two examples where machine learning models were used to identify neighborhood “types” in cities:
The authors explained how each type tended to change in different ways over time, so understanding what category or stage a neighborhood belongs to helps the city understand what types of changed might be emminent.
In Lab 02 you looked at examples where particular scaled or instruments have been developed to measure latent constructs - phenomenon that are difficult to directly observe, but are important outcomes to measure.
What is the relationship between these two labs?
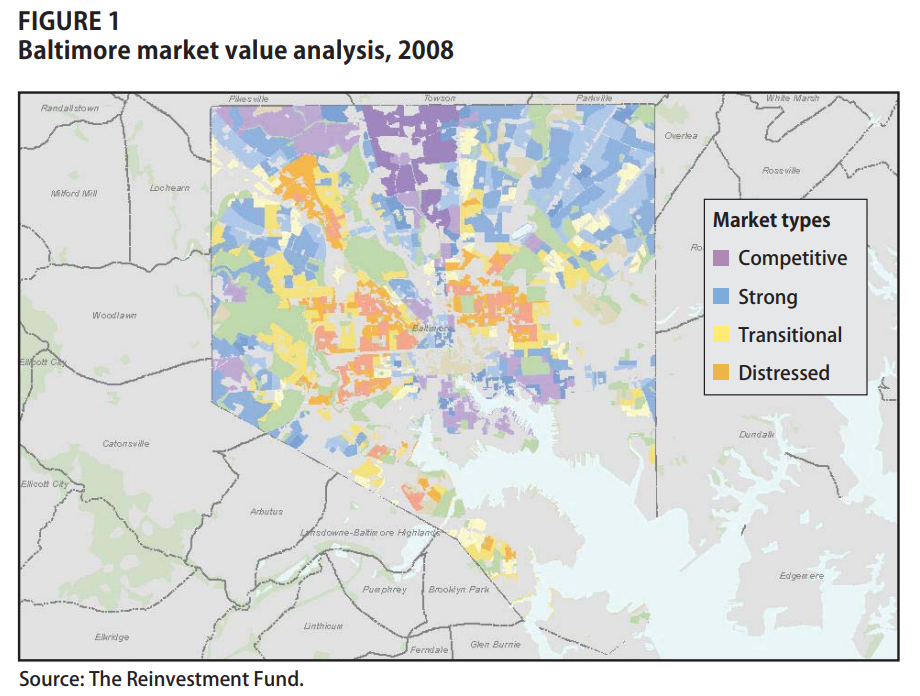
Let me offer you a hint. If I gave you a list of all of the variables used in the Market Value Analysis study referenced above and another Cronbach’s alpha calculator, would you be able to come up with a reliable scale to measure each of the four neighborhood types?
- Competitive
- Strong
- Transitional
- Distressed
If you read about the methodologies in both chapters, you will see that the advanced machine learning methods they apply are not doing anything much more complicated than what you were doing when creating scales for “Community Well-Being”. The main advantage that a computer has is the ability to try every combination of variables in order to find the optimal ways to group them to create distinct dimensions of community health. Once the computers identify the stable groups it is up to the human to come up with meaningful titles for each, and to determine if the groups actually tell us anything useful about the world (just like we would like to know if Meyers Briggs Scores tell us something useful).
I would like to suggest that if you understood Lab 02, you might be capable of using predictive analytics to moneyball programs in your organization. The hardest part is identifying the right types of data to collect and ensuring it is high quality. You can always hire data scientists to build the models once your organization has begun collecting meaningful data.
In the previous two labs you were provided with a set of variables, so you did not have to think very hard about where that data came from and why we selected specific variables for each model.
This lab challenges you to break open the black box, and think about the process of identifying the data to collect for a project. How do you know which variables are useful? How do you know what data is needed to predict success.
The short answer is you don’t, not if you are starting a new project. This lab is about “feature selection” - the process of identifying the data you will need for your project.
Start by listening to this story about the birth and evolution of a large-scale data-driven social program. Pay particular attention to how the researchers figured out what data they needed for the program.
“Data is like vegetables. It needs to be fresh, and it needs to be local.”
How long did it take Iceland to develop their survey for youth? Did they know what they were looking for when they started?
Feature Selection
If we want to “moneyball” a problem, we need to identify the data that is best suited for predicting the outcome. At the beginning of most projects, however, we rarely know which factors will be the biggest drivers of outcomes.
For example, which school characteristics best predict student performance? Is it the facilities and technology? The level of funding? Classroom sizes? Training and support provided to teachers? Parent involvement? Peer networks? All of these are plausible drivers of student performance – the most important factors are rarely self-evident in advance of having data to test them all.
“Feature selection” is data science speak for generating a set of hypotheses and measures about what generates the outcome of interest. In many cases, feature selection is an iterative process of generating hypotheses then determining how to find or collect data to test them.
Feature selection requires critical thinking and creativity more than technical expertise, but is a core component of any successful data science project.
Lab Takeaway: Your data experts will not be domain experts, so they are not always good at identifying useful features. The best approach is often to assemble people close to the problem, brainstorm a large list of features, collect test data, and see what is working before you encode your data collection process in an enterprise platform that the organization will use for decades. More learning occurs during this phase of the project than any other.
PART 1: Predicting Divorce in 3 Minutes
The following excerpt from Malcolm Gladwell’s book Blink describes the work of John Gottman, one of the world’s foremost experts on predictors of divorce in marriage. Unlike many scholars that study marriage and divorce in the academic field of counseling, Gottman did not approach the problem using traditional psychological theories and counseling tools. Instead he brought a data-driven approach to the subject and meticulously developed models to predict whether relationships would last or would end in divorce.
Since the 1980s, Gottman has brought more than three thousand married couples—just like Bill and Sue— into that small room in his “love lab” near the University of Washington campus. Each couple has been videotaped, and the results have been analyzed according to something Gottman dubbed SPAFF (for specific affect), a coding system that has twenty separate categories corresponding to every conceivable emotion that a married couple might express during a conversation. Disgust, for example, is 1, contempt is 2, anger is 7, defensiveness is 10, whining is 11, sadness is 12, stonewalling is 13, neutral is 14, and so on.
Gottman has taught his staff how to read every emotional nuance in people’s facial expressions and how to interpret seemingly ambiguous bits of dialogue. When they watch a marriage videotape, they assign a SPAFF code to every second of the couple’s interaction, so that a fifteen-minute conflict discussion ends up being translated into a row of eighteen hundred numbers—nine hundred for the husband and nine hundred for the wife. The notation “7, 7, 14, 10, 11, 11,” for instance, means that in one six-second stretch, one member of the couple was briefly angry, then neutral, had a moment of defensiveness, and then began whining. Then the data from the electrodes and sensors is factored in, so that the coders know, for example, when the husband’s or the wife’s heart was pounding or when his or her temperature was rising or when either of them was jiggling in his or her seat, and all of that information is fed into a complex equation.
On the basis of those calculations, Gottman has proven something remarkable. If he analyzes an hour of a husband and wife talking, he can predict with 95 percent accuracy whether that couple will still be married fifteen years later. If he watches a couple for fifteen minutes, his success rate is around 90 percent.
Recently, a professor who works with Gottman named Sybil Carrère, who was playing around with some of the videotapes, trying to design a new study, discovered that if they looked at only three minutes of a couple talking, they could still predict with fairly impressive accuracy who was going to get divorced and who was going to make it. The truth of a marriage can be understood in a much shorter time than anyone ever imagined.
Gladwell, M. (2006). Blink: The power of thinking without thinking. CH1 The theory of thin slicing. PDF
Some key findings from Gottman’s years of research can be summed up by his description of the “Four Horseman of the Apocolypse” - the signs that a relationship is in danger. In this interview he describes the signs and gives examples and demonstrates using video clips of couples:
Recall he began with a code book of twenty distinctive emotions that can be conveyed during a conversation. How difficult would it be for you to accurately differentiate between all 20 emotions using only the video clip? How did Gottman develop this system?

A math major at MIT before he switched to psychology, Gottman developed a coding system that not only tracked the content of speech but the emotional messages that spouses send with minute changes in expressions, vocal tone, and body language. Using facial recognition systems, Gottman’s code accounts for the fact that, for instance, in “coy, playful, or flirtatious interactions,” the lips are often turned down. “It looks like the person is working hard not to smile,” he writes. Conversely, “many ‘smiles’ involve upturned corners of the mouth but are often indices of negative affect.” [ Dissecting Gottman’s Love Lab: Slate Magazine ]
Note that in this case, “using facial recognition systems” does not refer to computer algorithms, rather just training grad students to watch hours and hours of interviews!
Gottman’s contribution was figuring out how to systemetize data collection about marital conflict. He may have ended up with 20 emotional constructs that were coded in all of the studies, but he no doubt started with dozens more ideas that were intractable to operationalize or not predictive of the outcomes. The list was eventually narrowed to 20, and time was spent on improving the coding protocols so data could be collected consistently.
To use the language of data science, Gottman went through a process of feature selection - identifying a set of meaningful variables that have the potential to predict the outcome of interest and looking for which are most useful. Loosely speaking, the more highly correlated a feature (variable) is with the outcome, the better a predictor it will be.
PART 1 - QUESTIONS
- Gottman’s lab records 15-minute videos of each couple, which sounds like a small amount of data relative to some of the other case studies we have examined this semester. How many data points are generated from those 15 minutes of footage, though? Stated differently, many observations do the lab scientists record in each 15-minute interview?
- What is the measured outcome in the study described by Gladwell? How would that data be collected? And consequently how long did these studies take? Note that in machine learning jargon this would be called the “training dataset” since it includes outcomes that are used to train computer models which features are useful to accurately predict the outcome. The calibrated models can then be used to predict outcomes using data that does not include results.
- Do you think that a marriage counselor working with couples for 30 years would be able to accurately predict those that will get divorced after a fifteen minute session 95 percent of the time, relying on intuition from practice alone? What was unique about Gottman’s approach that allowed him to achieve that kind of accuracy?
Reflection: What is the most important example of prediction that occurs in your organization? Winning a contract from a new client? Forecasting crime? Predicting student success? Currently how are those predictions made?
PART 2 - PREDICTING HOME VALUES
The hard part of feature selection is that it’s always fairly easy to generate a large list of candidate variables, and often the only way to know which actually work is to test them all. It is typically hard to predict which variables might be more predictive before collecting data and testing them out.
The course reading by Duhigg that introduces the idea of information blindness recounts two stories of managers that have been successful at leveraging data
Duhigg: Smarter Faster Better: CH8 Absorbing Data
Consider the project to reduce harmful levels of binge drinking by youth in Iceland. To identify some key causes of binge drinking they developed literally hundreds of theories, and tested as many as they could. Some explanations were still unexpected:
The team has analyzed 99,000 questionnaires from places as far afield as the Faroe Islands, Malta and Romania—as well as South Korea and, very recently, Nairobi and Guinea-Bissau. Broadly, the results show that when it comes to teen substance use, the same protective and risk factors identified in Iceland apply everywhere. There are some differences: in one location (in a country “on the Baltic Sea”), participation in organized sport actually emerged as a risk factor. Further investigation revealed that this was because young ex-military men who were keen on muscle-building drugs, drinking and smoking were running the clubs. Here, then, was a well-defined, immediate, local problem that could be addressed.
Data scientists have grown very skilled at using data to predict home values before houses are listed for sale. Zillow’s median national error rate is under 4%, for example, meaning that more than half of their predictions about home values are within 4% of true selling prices. They are becoming so accurate that Zillow is experimenting with a new service of buying homes based upon their estimates and re-selling them on their platform without realtors ever being involved in order to bypass the painful process of spending 6 months in a house that is for sale.
How does Zillow do this? Which variables or features are the best predictors of home values? The variables (“features”) that Zillow uses in their model are reported below. Can you guess the three factors that are most predictive of home value just by reading the list?
| Feature | Description |
|---|---|
| airconditioningtypeid | Type of cooling system present in the home (if any) |
| architecturalstyletypeid | Architectural style of the home (i.e. ranch, colonial, split-level, etc…) |
| basementsqft | Finished living area below or partially below ground level |
| bathroomcnt | Number of bathrooms in home including fractional bathrooms |
| bedroomcnt | Number of bedrooms in home |
| buildingqualitytypeid | Overall assessment of condition of the building from best (lowest) to worst (highest) |
| buildingclasstypeid | The building framing type (steel frame, wood frame, concrete/brick) |
| calculatedbathnbr | Number of bathrooms in home including fractional bathroom |
| decktypeid | Type of deck (if any) present on parcel |
| threequarterbathnbr | Number of 3/4 bathrooms in house (shower + sink + toilet) |
| finishedfloor1squarefeet | Size of the finished living area on the first (entry) floor of the home |
| calculatedfinishedsquarefeet | Calculated total finished living area of the home |
| finishedsquarefeet6 | Base unfinished and finished area |
| finishedsquarefeet12 | Finished living area |
| finishedsquarefeet13 | Perimeter living area |
| finishedsquarefeet15 | Total area |
| finishedsquarefeet50 | Size of the finished living area on the first (entry) floor of the home |
| fips | Federal Information Processing Standard code - see https://en.wikipedia.org/wiki/FIPS_county_code for more details |
| fireplacecnt | Number of fireplaces in a home (if any) |
| fireplaceflag | Is a fireplace present in this home |
| fullbathcnt | Number of full bathrooms (sink, shower + bathtub, and toilet) present in home |
| garagecarcnt | Total number of garages on the lot including an attached garage |
| garagetotalsqft | Total number of square feet of all garages on lot including an attached garage |
| hashottuborspa | Does the home have a hot tub or spa |
| heatingorsystemtypeid | Type of home heating system |
| latitude | Latitude of the middle of the parcel multiplied by 10e6 |
| longitude | Longitude of the middle of the parcel multiplied by 10e6 |
| lotsizesquarefeet | Area of the lot in square feet |
| numberofstories | Number of stories or levels the home has |
| parcelid | Unique identifier for parcels (lots) |
| poolcnt | Number of pools on the lot (if any) |
| poolsizesum | Total square footage of all pools on property |
| pooltypeid10 | Spa or Hot Tub |
| pooltypeid2 | Pool with Spa/Hot Tub |
| pooltypeid7 | Pool without hot tub |
| propertycountylandusecode | County land use code i.e. it’s zoning at the county level |
| propertylandusetypeid | Type of land use the property is zoned for |
| propertyzoningdesc | Description of the allowed land uses (zoning) for that property |
| rawcensustractandblock | Census tract and block ID combined - also contains blockgroup assignment by extension |
| censustractandblock | Census tract and block ID combined - also contains blockgroup assignment by extension |
| regionidcounty | County in which the property is located |
| regionidcity | City in which the property is located (if any) |
| regionidzip | Zip code in which the property is located |
| regionidneighborhood | Neighborhood in which the property is located |
| roomcnt | Total number of rooms in the principal residence |
| storytypeid | Type of floors in a multi-story house (i.e. basement and main level, split-level, attic, etc.). See tab for details. |
| typeconstructiontypeid | What type of construction material was used to construct the home |
| unitcnt | Number of units the structure is built into (i.e. 2 = duplex, 3 = triplex, etc…) |
| yardbuildingsqft17 | Patio in yard |
| yardbuildingsqft26 | Storage shed/building in yard |
| yearbuilt | The Year the principal residence was built |
| taxvaluedollarcnt | The total tax assessed value of the parcel |
| structuretaxvaluedollarcnt | The assessed value of the built structure on the parcel |
| landtaxvaluedollarcnt | The assessed value of the land area of the parcel |
| taxamount | The total property tax assessed for that assessment year |
| assessmentyear | The year of the property tax assessment |
| taxdelinquencyflag | Property taxes for this parcel are past due as of 2015 |
| taxdelinquencyyear | Year for which the unpaid propert taxes were due |
Zillow tracks an impressive amount of data on homes, but this dataset is far from exhaustive. If we wanted to improve their models by adding new data, which features of homes and neighborhoods would you propose?
Instructions:
For Part II of this lab, in order to demonstrate what a feature selection exercise might look like, you need to come up with one variable that predicts home value that is not included in the Zillow dataset.
The obvious things are already present - square footage, number of bedrooms, whether there is a garage and a pool, etc. You need to be a little creative to come up with another factor.
Note that features in this case might be characteristics of houses themselves, but they also might be characteristics of neighborhoods or cities. These broader characteristics of the community, positive or negative, are baked into the selling price of the home.
You only need to think up one other variable that impacts home values. There are hundreds more. In order to verify whether your hunch was correct, you need to identify an academic article or peer-reviewed report that supports your claim. I suggest using Google Scholar, but many search engines would work fine.
For example, I might hypothesize that high-end restaurants or coffee shops increase the value of homes. After a little searching I found this study: Measuring Gentrification: Using Yelp Data to Quantify Neighborhood Change.
We find that changes in the local business landscape is a leading indicator of housing price changes.. Each additional Starbucks that enters a zip code is associated with a 0.5% increase in housing prices.
What to Submit:
For Part II, (1) write a couple of sentences about your predictor and how you think it will impact home values. Include a citation to the article that supports your claim. Submit this together with your answers to Part I on Canvas. Also, (2) report your findings to your classmates on a thread I have created on YellowDig called “Home Value Predictors”.
Good luck!